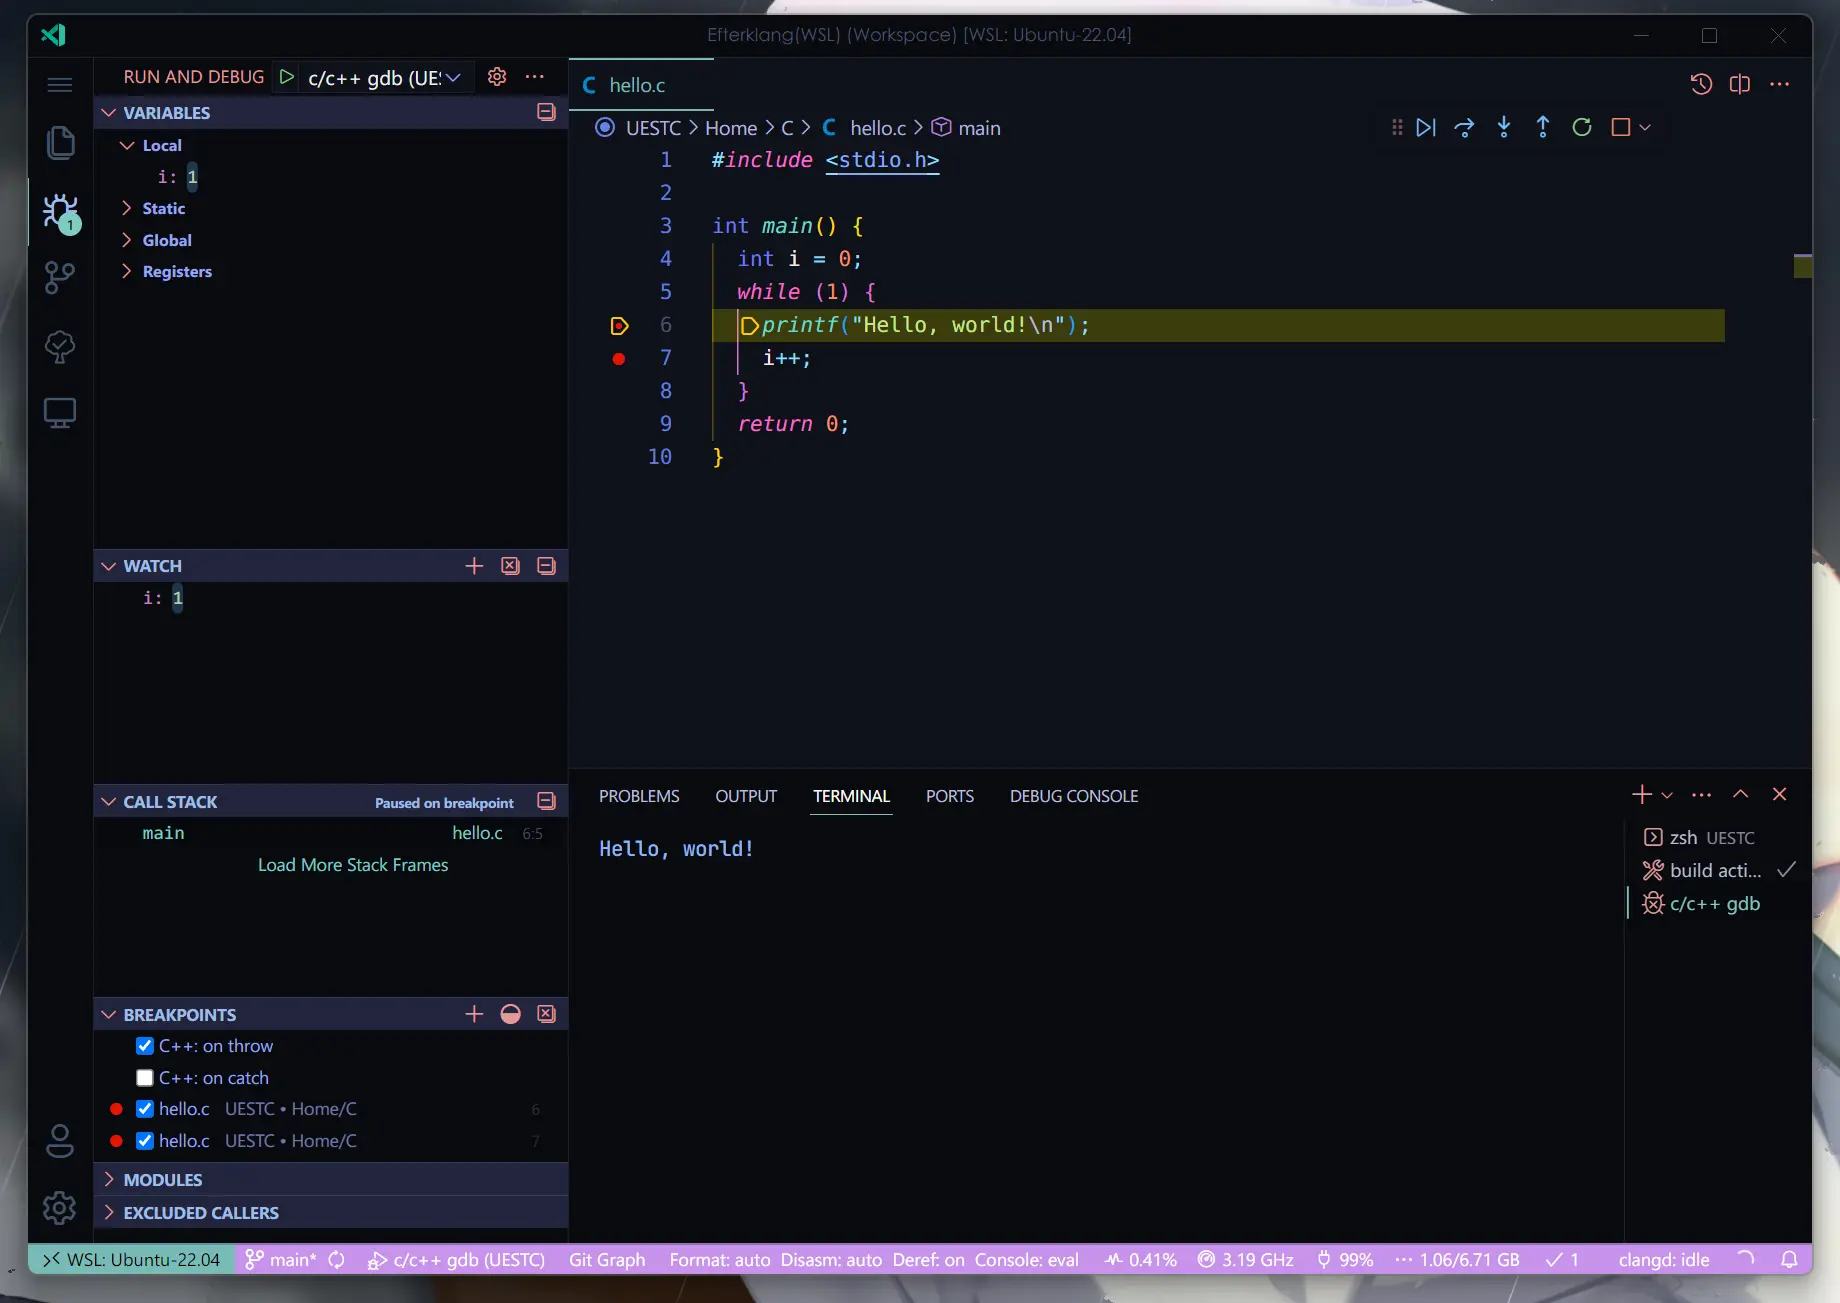
Today I read Configure launch.json for C/C++ debugging in Visual Studio Code and got a basic VSCode C/C++ debug setup working. This post records how I configured the C/C++ debug environment in VSCode on Windows/WSL, as a reference for other beginners. Before starting, you need VSCode installed, a working WSL environment, and gcc on your PATH.
The article explains the meaning of some of the attributes in launch.json and tasks.json, and includes my own configurations for reference.
Steps
launch.json
To set up debugging, first configure launch.json. launch.json configures VSCode’s debug environment. It contains a list of debug configurations; each one is an object with a set of fields that define how to start and run the debugger. In VSCode, you can enter debug mode with F5 or by clicking the debug button in the sidebar. VSCode then looks for a launch.json file in the current working directory. If it can’t find one, VSCode prompts you to create it; if it finds one, VSCode loads the configurations from launch.json and starts the debugger accordingly.
A
launch.jsonfile is used to configure the debugger in Visual Studio Code.Visual Studio Code generates a
launch.json(under a.vscodefolder in your project) with almost all of the required information. To get started with debugging you need to fill in theprogramfield with the path to the executable you plan to debug. This must be specified for both the launch and attach (if you plan to attach to a running instance at any point) configurations.
Launch.json Code
Here is my configuration, for reference only{ "version": "0.2.0", "configurations": [ { "name": "c/c++ gdb", "type": "lldb", "request": "launch", "args": [], "cwd": "${fileDirname}", "console": "integratedTerminal", "windows": { "program": "${fileDirname}/${fileBasenameNoExtension}.exe", "preLaunchTask": "compile c file(Windows)" }, "linux": { "program": "${fileDirname}/${fileBasenameNoExtension}.out", "preLaunchTask": "compile c file(Linux)" } } ]}
Attributes
version: version of this file format
No need to change thisconfigurations: List of configurations.
An array of configurations holding your debug setups. Each debug configuration is an object with a set of fields that define how to start and run the debuggertype: Type of configuration
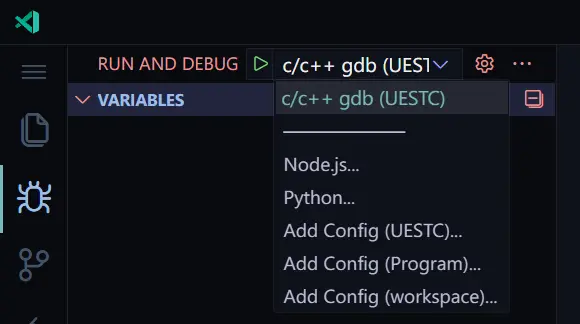
Specifies which debugger to use. The available values depend on the debugger extensions you have installed. Common values for the type field includenode, java, lldb (mainly for debugging c/cpp and other LLVM-supported languages), chrome (JavaScript, TypeScript), and so onname: Name of configuration; appears in the launch configuration dropdown menu.
Exactly what it says; herec/c++ gdbis thenameinlaunch.json
preLaunchTask: Task to run before debug session starts.
A task executed before debugging starts, such as compiling your code to produce an executable (.exe, .out e.g.). If the task fails, the debug session won’t start. Since we’re setting up a c/cpp debug environment here, set preLaunchTask to build active file (any name works), as long as it matches the label attribute of the task object intasks.jsonprogram: Path to the program to debug.
Specify the debug program’s path. Taking Windows as an example, if we wrote hello.c, the program to debug isfilePath/hello.exe. We can simplify program with the following pre-defined variablesCommon pre-defined variables provided by VSCode for configuration files:
${workspaceFolder}: The path of the folder opened in VS Code.${workspaceRootFolderName}: The name of the folder opened in VS Code without any slashes (/).${file}: The current opened file.${fileWorkspaceFolder}: The current opened file’s workspace folder.${relativeFile}: The current opened file relative to workspaceFolder.${relativeFileDirname}: The current opened file’s dirname relative to workspaceFolder.${fileBasename}: The current opened file’s basename.${fileBasenameNoExtension}: The current opened file’s basename with no file extension.${fileDirname}: The current opened file’s dirname.${fileExtname}: The current opened file’s extension.${lineNumber}: The current selected line number in the active file.${selectedText}: The current selected text in the active file.${execPath}: The location of the VS Code executable.${defaultBuildTask}: The name of the default build task.
request: Indicates whether the configuration section is intended to
launchthe program orattachto an already running instance.
Usually pick launch; attach may come up in frontend debuggingconsole: Terminal type to use.
A matter of personal preference. The options areinternalConsole: the TERMINAL in the VSCode Panel
integratedTerminal: the DEBUG CONSOLE in the VSCode Panel
externalTerminal: an external integrated terminal
cwd: Program working directory.
Thecwdfield sets the Current Working Directory. When you start the debugger, this directory is used as the program’s working directory; it’s usually set to"cwd": "${fileDirname}"window/linux/osx: specific launch configuration attributes
Attributes set separately for the Windows, Linux/WSL, and MacOS platforms
tasks.json
For the debugger to work, your code has to be compiled into an executable first (.exe, .out e.g.), so in preLaunch we defined two tasks to compile the c file.
Tasks.json Code
{ "version": "2.0.0", "tasks": [ { "type": "shell", "label": "compile c file(Windows)", "command": "gcc", "args": [ "-g", "${file}", "-o", "${fileDirname}\\${fileBasenameNoExtension}.exe" ] }, { "type": "shell", "label": "compile c file(Linux)", "command": "gcc", "args": [ "-g", "${file}", "-o", "${fileDirname}/${fileBasenameNoExtension}.out" ] } ]}Attribute
tasks: The task configurations. Usually these are enrichments of task already defined in the external task runner.
For example, the twotasks defined earlier inlaunch.json"windows": { "program": "${fileDirname}/${fileBasenameNoExtension}.exe", "preLaunchTask": "build active file(Windows)"},"linux": { "program": "${fileDirname}/${fileBasenameNoExtension}.out", "preLaunchTask": "build active file(Linux)"}type: Defines whether the task is run as a process or as a command inside a shell.
The options are shell and process. The gcc command runs in a shell, so pick shell herelabel: The task’s user interface label
The task’s name;launch.jsonuses the label to specify which tasks to runcommand: The command to be executed. Can be an external program or a shell command.
gcc works here; you can also pick clang or another c/cpp compilerargs: Arguments passed to the command when this task is invoked.
The command’s arguments, such as -o, -g, and so on
Outro
Tested with the classic hello.c, and debugging works fine. I hope this post helps you 🕊️